
But it tells of inflation, nevertheless.
At 9 a.m. ET today, S&P Dow Jones Indices released the latest results of the S&P Cotality Case-Shiller Indices, formerly known as the S&P CoreLogic Case-Shiller Indices.
Data through May 2026 reveals the following:
Year-Over-Year
- The S&P Cotality Case-Shiller U.S. National Home Price NSA Index, covering all nine U.S. census divisions, reported a 1.1% annual gain in May, up from a 0.9% rise in the previous month.
- The 10-City Composite saw an annual increase of 2.4%, up from a 1.8% increase in the previous month. The 20-City Composite posted a year-over-year increase of 1.6%, up from a 1.2% rise in the previous month.
- Chicago, New York and Cleveland reported the highest year-over-year gains with year-over-year price increases of 6.9%, 4.2% and 3.1%, respectively.
- Las Vegas posted the lowest return in May, falling -1.9% year over year.
Month-over-Month
- The pre-seasonally adjusted 10-City Composite and 20-City Composite Indices recorded monthly gains of 0.9%, while the U.S. National Index posted a 0.6% gain.
- After seasonal adjustment, the U.S. National reported a monthly decrease of 0.05% while the 10-City
and 20-City Composite Indices posted 0.3% and 0.1% gains, respectively.
Historical
- Measured from its June 2022 peak, the 10-City Composite is up 12.5%.
- The 20-City Composite is up by 9.4%.
- The National Index is up 8.8% from its June 2022 peak.
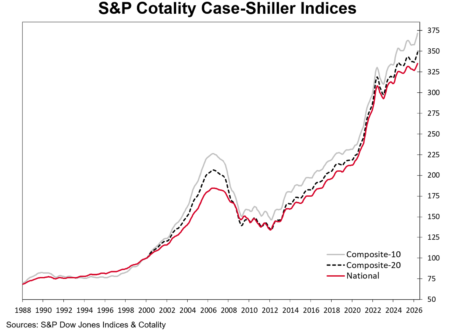
Remember, add three zeroes to the right axis number fol the home price.
Write when so moved…,
~ure
G.A. STEWART: Previously, I wrote that I was done with blogging. In a sense I am; right now, I am organizing myself and recruiting for the Big Meltdown. I believe that people’s heads will explode when they see how quickly civilization collapses.
Sometimes the universe telegraphs answers and options, and I will address that at the end of this post. I need civilization to hang in there for another month. I am in the process of buying a house, because I believe that it is all going to fall apart very soon, and it’s better to be in my home than someone else’s.
It is the peak of the real estate market, and the lease on my rental house is up in October. Rent is now as high as a mortgage, and for the same money, I bought a very nice new house on the edge of a nature preserve.
It is pretty close to scary now, and that should be obvious to anyone with half-a-brain.
https://theageofdesolation.com/nostradamus/2026/07/28/the-crocodile-cometh/
“I am in the process of buying a house, because I believe that it is all going to fall apart very soon, and it’s better to be in my home than someone else’s.”
Unless you’re paying cash for the house, you’ll still be living in someone else’s home. Namely the bank’s.
Cash or fully financed are the safest ways to own property. In the former case, you can insure or not as you see fit, and completely own the property – to the extent that individuals can own anything. In the latter case you can walk away in most cases.
In between, you have your house at risk and also whatever equity you may have in it. If we get a sharp collapse, real property will become even more illiquid than it is already. You still need to insure and maintain as agreed rather than what might make better sense.
Clip side – and I model this all the time Mike – you still need somewhere to live…
Also, with “fully-financed,” you’re living in something which would look really bad on a bank’s asset/liability sheet. Banks and loancos rarely foreclose on properties upon which there’s little to no equity. Financing the down payment, then living for 5-10 years on an interest-only balloon, then paying off completely, if it is still allowed, is the next-best strategy for living through a depression, to being fully paid-off before the SHTF…
Unfortunately you’ll always be living in someone else’s home as long as there are property taxes. It used to be nice to have “squatters rights”, but that seems to matter less and less all the time.
But at least the government has to give fair market value – with paper fiat they make up….oh shit….
Crazy old man spearament…..
Almost everyone has heard my fifty?plus?year rant about solar towers — putting one at every substation, handing out grid?tied solar to any homeowner willing to install panels, turning neighborhoods into resilient nodes that strengthen national security. With remote disconnects, the power company still keeps control. Add CO2 filters on every city streetlight to replace the trees we lost when urban expansion removed the trees. Greenscape the cities. And in arid regions, build air wells to help replenish aquifers.
Well… this spring I had a new twist on the air?well idea, and it’s turning into a fall expansion project. It started with my folding hydroponic system concept for easy storage.
A guy I used to know, Larry Hall, started the Rain Gutter Grow System fad. The local grain elevator sells cattle feed in twenty?gallon tubs, and that got me thinking: what if…
One early spring morning, sitting in my magic chair with a cup of coffee, I noticed dew rolling off the greenhouse roof just like a miniature air well. The weeds were huge, and while staring at them I had a “what?if” moment. I’ve been planting potatoes in those tubs — usually I get about twenty pounds if I’m lucky. So I grabbed the two?wheel cart and moved the tubs directly under the roof so the dew would drip into them. I set another tub off to the side where it only got normal watering, like a basic drip?feed setup.
The results so far?
The dew?fed tubs have plants twice the size of the others. It’s already obvious I’ll double, maybe even triple, my harvest.
So this fall, I’m putting up a fence line using tin roofing panels as a sloped peak roof. I’ll set the buckets on a watering trough, just like the Rain Gutter Grow System, so the roots stay fed — and the dew from my little air?well roof will dribble right into the buckets.
Turning dew into irrigation… who knew?
https://youtu.be/KOZKkpyJLf0?si=62WIL8W59dyn9R-N
https://chatgpt.com/s/m_6a68bff2a4d881918163359902f6bc0a
https://chatgpt.com/s/m_6a68c08eda188191a51da9681f1a4df6
Went with the grow bags(10 Gal.) on the zon for Taters this year – nice Tan colored ones.
Bout mid July is perfect time to plant the seed taters here in SE Pennsyltucky. The raised beds growing space in late Summer, what with Vines and crap growing all over the place, needed moar room for Mother Nature to stretch her legs out in.
Hurricane “Grand Daughter” was up last night after Day Camp for Din-Din, and Thunderstorm watching party..her Daddy away on business overnight. She was out in Gardens early on..before the storms hit, picking Fruits, Veggies and some Herbages(Tea fixins). She found a couple of rouge Cucumbers and picked them for GrandMa.
My Daughter says to me that her Daughter loves eating Cucumbers ????? Not surprised by ANYTHING regards this Child, I gave Her one back to eat. She proceeded to Chomp down on that thing with some gusto. Never seen anything like it before, She eats it like an Apple..chomp, chomp, chomp. Well there went one less spicey and snappy Dill pickle for GrandPa, which is just fine by me.
After her dinners and changeS of clothes, we have a Waterfall/winding stream feature in back yard fenced area, she sneaked right back out to pond under waterfall with Russels in tow. Next thing I know She strips off her clothes while laying on her back, and try’s to jump in water. I was on her as her foot hit the water..NEIN,NEIN,NEIN! Had her put back together and headed into House before Mom or GrandMa found out. What she was doing in GrandMa’s Subaru parked Garage with one of the Russels..?
I know NOTHING!
Wife was a little irritated this AM when she came out to Garage to find her vehicle had been used for Playtime last night…whoops.
(She was out in Gardens early on..before the storms hit, picking Fruits, Veggies and some Herbages(Tea fixins). She found a couple of rouge Cucumbers and picked them for GrandMa.”)
my grand daughter saved me from watering the veggies yesterday.. I got to pick green beans..in 2012 I planted half of my garden on the first week of march..everyone thought I was nuts..but that was the only portion of the garden I got anything out of.. picking green beans I got only enough for the wife and myself..the skins were so tough they couldn’t be eaten..I love cherry tomatoes.. usually I get a lot ..ice cream buckets full..this year I got a cereal bowl full….the corn in the fields look promising but are there any kernels on the cobs?
I planted six 70′ rows of green beans this year and never got a single bean. Rabbits ate every one of ’em. Same with the purplehull peas. At least the coyotes will eat well this winter.
Squash, on the other hand, went ape. We ate squash until we turned yellow, then started giving it away. All gone now, though.
Note to dLynn: Can you inform olfart on the use of high-speed lead rabbit repellant? I married “aged bunny” so any thing I say is likely to be wrong.
(“U.S. National Home Price NSA Index, covering all nine U.S. census divisions, reported a 1.1% annual gain in May, up from a 0.9% rise in the previous month.
The 10-City Composite saw an annual increase of 2.4%, up from a 1.8% increase in the previous month. The 20-City Composite posted a year-over-year increase of 1.6%, up from a 1.2% rise in the previous month.
Chicago, New York and Cleveland reported the highest year-over-year gains with year-over-year price increases of 6.9%, 4.2% and 3.1%, respectively.”)
hmm……is it truly different than what I’m seeing here on the bottom..or are the analysts puffing smoke up the asses of those that live in neighborhoods where the real life issues simply don’t exist….
The national home price numbers they’re reporting don’t match what I’m seeing on the ground. Around here, a home that cost about $35,000 twenty years ago is now $350,000 to $500,000. My own property tax valuation tripled in a single year. When you look at that kind of jump,Well it’s hard to believe the national averages are only showing 1–2 % increases. Locally, the percentage is far higher.
The part that worries me is wages.
A job that paid $11.75 an hour two years ago is now only $14.50. That’s nowhere near enough to keep up with housing costs…. The American dream of home ownership is becoming unsustainable for the general wage earner.
Then add the accelerated national deficit, billions spent overseas through ongoing police?action involvement, and the loss of domestic industries that used to anchor our supply chain. We’re depending more and more on other countries for basic goods.
Put all of this together, and it feels like we’re heading toward a major situation — one that could result in a catastrophic economic event if something doesn’t change…..
maybe I’m looking at this differently than what they are seeing..last night there was a major news story about this very thing..tgat people are not able to buy food because of increased inflation..
Depression bread cake….
my mom use to make this..save the heels let them dry.. blend until it resembles bread crumbs…
4 cups stale bread (torn or crumbled)
2 cups water
1 cup sugar
½ cup milk
1/4 cup butter
1 teaspoon baking powder
1 teaspoon vanilla (optional)
Cinnamon or nutmeg (optional)
1 egg (optional — makes it richer, but not required you can add more eggs to)
Put the bread, water, sugar, and butter in a pot.
Simmer until the bread breaks down into a thick mush — like oatmeal.
This is what turns the mush into a cake instead of a brick….
Egg gives lift and richness.
Cinnamon makes it taste like bread pudding cake.
Bake at 350°F for 30–40 minutes
(or until the center is set).
pour over your glaze.. store bought frosting warmed in microwave 1/4 stick butter mixed in and about 1/4 cup of milk added 1 tbs at a time..
you can do this with cookies two..
3 cups crushed cookies (any type: vanilla wafers, graham crackers, chocolate cookies)
2 cups water
1 cup sugar
1/4 cup butter ( 1 stick)
1/2 to 1 cup milk
1 cup all?purpose flour
2 tsp baking powder
1 tsp vanilla (optional but not used if you use chocolate cookies)
1 tsp cinnamon or cocoa (optional)( not used if you use chocolate cookies)
remember always use this in life…… Adapt , improvise, and overcome…
My mom used to make your “bread cake”, but she called it bread pudding. I loved it then, and I still do! Great stuff!
To make peanut butter muffins or cake … add 1/2 cup to the mush while its hot.. and use one cup brown sugar rather than white sugar..
my mother used cinnamon and raisins..
without the flour it was more of a bread pudding..when she baked bread every Thursday.. she would let what was left dry out and the results was Sunday dinner desert..
There are so many variations of the delectable.. depression desserts…
Hoover stew..we use to call that seven day stew..refried beans..still a favorite with me..tortilla apple pie.. or meat pie..today they sell them as hot pockets..
the kids have a Quesadilla Maker..I don’t have one of those mostly due to the fact that I have a hot pocket maker..when the grand kids and kids were young we made thousands of hot pockets and hot pocket pies using two slices of bread..the one thing everyone of the kids is fighting over is the malt maker..I actually bought one for each..once I’m gone I don’t want everyone fighting over some crap..
U Bee talking Ceylon Cinnamon ?
location, location, location
U should, Bee
Oops I forgot…1 to 3 eggs… the stale bread one is awesome like a spice cake.. white frosting glaze…yumm
Cinnamon makes it resemble cinnamon rolls…1/2 to 1/2 tsp of nutmeg ( totally optional )
If you want it caramel and richer 1/2 cup of white sugar 1/2 cup brown sugar…
as a catfish at the bottom of the economic pond..well there are some luxuries lol lol..
and its up to you.. add chocolate chips.. and put in muffin tins.. vanilla spiced chocolate chip cookie muffins…
Golden Boy supports housing.
The tariffs he imposed on Canada included lumber. Go out and look at a house. Notice it’s built using lumber. Lumber is needed for houses. Elevator up. This is the Golden Age!
Fact Sheet: President Donald J. Trump Imposes Additional Tariffs on Canada
– July 20, 2026
“President Trump has taken actions under Section 232 to protect and strengthen U.S. manufacturing critical for our national and economic security, including imposing tariffs on key goods such as steel, aluminum, copper, trucks and automobiles, timber, lumber, and pharmaceuticals. ”
https://www.whitehouse.gov/fact-sheets/2026/07/fact-sheet-president-donald-j-trump-imposes-additional-tariffs-on-canada/
Look at the wires of a house -copper!
“President Trump implemented aggressive Section 232 tariffs on foreign copper, initially imposing a 50% duty on semi-finished and copper-intensive products. ”
Look at the plumbing of a house -copper or plastic PEX:
“President Trump’s recent trade policies target plastics through new 50% levies on specific Canadian goods, 10% to 12.5% global forced-labor tariffs, and modified Section 232 metal equipment duties.”
Canada has employed draconian tariffs on U.S. lumber for 60 years.
Anyone who doesn’t frame their house with Southern Yellow Pine is an idiot. SPF is fine for studs. For anything that’s load-bearing, people who build to last, build with SYP, so the tariffs don’t matter.
Chinese copper has a nasty habit of turning to dust, after a few years. I won’t plumb with it, and sure-as-hell won’t wire with it. There are too many American sources for good copper for this to be an issue, except with builders who build junk, tinderbox houses.
My house is plumbed with CPVC, which is made in USA and costs about 60% more than it did, 45 years ago — and American copper…
Next time, perhaps you should read the “Section 338” press release before you start wringing your hands and trolling…
Not exactly, Canada has been charging China (3.3%) more import duties than the U.S. (0.2%), 2017
https://www150.statcan.gc.ca/n1/daily-quotidien/181019/t002d-eng.htm
U.S. Biggest Importer of Canadian Sawn Wood:
https://oec.world/en/profile/country/can#bespoke-title-337
Canada was the top Importer of U.S. Wood:
https://oec.world/en/profile/bilateral-product/wood-products/reporter/usa
After the Great Depression and WWII, lumber prices skyrocketed and many commodities were rationed. Because of that, colleges started teaching alternative building methods like rammed earth. I’ve seen a few of those structures myself — they’re incredibly impressive.
A professor I know even did a summer study on earth construction, and the results were so strong that Kansas opened a full course dedicated to earth and renewable building.
KU’s Dirt Works Studio is one example…
https://arcd.ku.edu/dirt-works-studio
I bought a CEB (compressed earth block) press for a mission in Africa so they could build homes, schools, and clinics. BYU students designed the wagon?wheel well drilling system, and I bought one of those presses for my own projects as well….
i wonder if eric and don jnr the great traders have taken secret positions before this FED meeting . ? . 100 % win rate . gurus
What if? Crocadile is happy tomorrow. NASDAC goes up tomorrow. No hindenbergs tomorrow. Enough food to feed Egypt. Musk is happy with new IPO. Trump Isreal and Ukraine have a solid front against east. China bankrupt tomorrow as can’t pay minor bill oil to Russia.
After a round-trip over the Rockies and back, the fishing shirts are back at the SanFran ‘black hole’ on Tuesday afternoon…like the Moody Blues.
Tue, Jul 28
3:09pm
Arrived at USPS Regional Facility
SAN FRANCISCO CA DISTRIBUTION CENTER, 94804
It would be nice if they kept the tracking past one hundred bounces..my pitcher coaster have been bouncing around the country for the better part of a year..lol lol I would totally enjoy seeing the total of their journey..