
I will be keeping most of the latest details on our Over-the-Horizon software work over on the Peoplenomics side of the house. There is some very sincere research underway now, and I think we may be getting close to a useful way of separating actual forecasting from the very human tendency to recognize the future only after it arrives.
There are at least two ways to attack the problem of “seeing” the future.
One approach begins with the idea that a very large population of internet users may collectively leak useful information about the future into their public postings. Millions of comments can be gathered, sorted, clustered and reduced until some underlying linguistic pattern emerges. Social media succeeded forums. A human analyst then studies those patterns and attempts to turn them into a forecast.
The second approach is rather less mystical. Read a gigantic number of ordinary news sources. Count words. Lump words with time-references (tomorrow, next week, in January, for example). Track changes in frequency. Follow relationships across time and subject domains. Hash the collected material along the way so that the original data cannot quietly mutate after the fact. Then let software identify unusual concentrations, accelerations and relationships.
Both methods can produce something that looks like a forecast. But looking like a forecast is not enough.
By my next birthday in February, we ought to have enough “prediction” laying around to score both approaches against events. And not with the usual sheepish fortune-teller standard of “See? Something happened that sounds vaguely like what I said.”
That is not forecasting. That is storytelling after the fact. The real question is much harder:
Did the method provide information that a competent analyst could not already have obtained from the information available at the time?
That distinction matters enormously. Suppose someone forecasts “violent water” sometime before year-end. Sounds dramatic enough. But what have we actually learned?
Right now a competent world watcher already has Hormuz, the Bab el-Mandeb approaches, the Black Sea, Odesa, Taiwan and several other maritime flashpoints on the board. Add seasonal flooding, tropical weather and one of the more remarkable ENSO setups in recent memory, and some variety of “violent water” becomes a very large target.
If enough darts are already heading toward a wall, putting a circle around the wall afterward doesn’t make you a marksman. Merely applying an early label does not create predictive specificity. Sometimes it demonstrates only skill in label-making.
And that brings us to the weather and its damp sidekick water.
ENSO’s Devilish Details
The latest ENSO outlooks are useful here because they illustrate how much of the future can already be inferred without invoking anything exotic. Treat ENSO as a tilt of the odds, not a script.
The Climate Prediction Center is now putting the 2026–27 event in very unusual territory, with exceptionally high odds of a very strong El Niño during the October-through-December peak period and a substantial possibility that it lands in historic company.
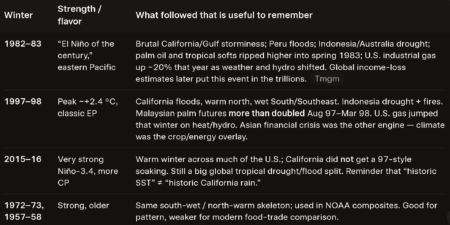
That immediately gives a strategic planner a comparison set: 1982–83, 1997–98 and 2015–16.
But even there, the future is not bespoke.
Those events did not produce identical weather. Where the Pacific heat concentrates matters. So does the atmospheric response. One very strong El Niño can drench parts of the West and South while another with similar headline strength produces a noticeably different rainfall map.
That uncertainty is important because it tells us what can reasonably be known now — and what would actually qualify as new information.
During late fall, the southern storm track generally becomes more interesting. California and the southern tier begin leaning wetter. Indonesia and parts of Australia can lean drier. Tropical agriculture begins carrying more weather risk.
Through winter, the classic El Niño pattern becomes more established if the atmosphere cooperates: wetter odds across portions of the southern United States, warmer and often drier conditions farther north, and a greater chance of transportation, agriculture and Gulf logistics being affected by persistent weather rather than one spectacular headline event.
Here in East Texas, the useful planning statement isn’t “floods coming.”
It is much duller and therefore much more useful: raise the odds of a wetter winter, expect more interruptions to field access, watch Gulf moisture and logistics, but don’t pretend September gives us the rainfall total for February.
The food effects also take time.
A serious ENSO excursion can begin stressing Southeast Asian agriculture, Australian crops, South American production and U.S. planting or harvesting windows well before the grocery-store consequences arrive. Food and energy consequences commonly develop over seasons, not Tuesdays.
Which gets us back to forecasting.
If the publicly available ENSO data already tells a reasonably competent analyst that the odds of water-related disruptions are rising, then announcing “water disruption ahead” has very little information value.
The question is: What did each forecasting system add?
Where Are the New Bits?
This may be the cleanest way yet to think about the whole future-prediction business.
Imagine all information already available to a capable analyst today as the baseline.
- Weather models are in there.
- Economic trends are in there.
- Shipping conditions are in there.
- Wars and military deployments are in there.
- Commodity flows, crop conditions, central-bank policy, political calendars, seasonal tendencies and known technological developments are all already in the box.
A forecasting system does not deserve credit for repackaging that box. It earns its keep only when it adds something useful that wasn’t reasonably inferable from the box.
That something is what I have begun thinking of as the TNT — The New Thing.
Not merely the next thing.
The new thing.
Suppose a forecast says there will be trouble involving shipping. Fine. We already know there is trouble involving shipping. $9 dollar diesel enough of a hint?
Suppose it says trouble will involve water. (Again, like Hormuz isn’t?)
Wonderful. There are wars being fought across and around water, historic ENSO conditions brewing and ordinary floods occurring every year.
Where are the new bits?
On the other hand, suppose a system identified a previously unnoticed risk to a particular class of industrial port, placed it within a reasonably narrow time window, anticipated a specific category of cargo being disproportionately affected and did so before conventional analysts had begun discussing it.
Now we have something worth measuring. Even if it turns out to be wrong.
In fact, a specific forecast that can clearly fail is scientifically more valuable than a vague forecast that can always be declared successful. Many have been – and in all kinds of fields.
That is one place where humans can get themselves into terrible trouble.
Test-Fitting the Future
We are excellent pattern-recognition machines. Often too excellent. It’s why I love the term Test-Fitting Apes.
Give a smart person an ambiguous forecast and a complicated world six months later and he can almost always find a correspondence.
- A flood fits.
- A port closure fits.
- A naval action fits.
- A hurricane fits.
- A shipping collapse fits.
- A drought that interrupts river traffic may fit.
- Even a severe economic contraction that empties ports and leaves cranes standing idle could be retold as a kind of “coastal event.”
At some point the interpretation becomes so elastic that the forecast cannot lose. And once a forecast cannot lose, it has ceased being useful science.
This is exactly the sort of behavior I explored Test-Fitting Apes. Humans are wonderfully adept at taking imperfectly fitting pieces and persuading ourselves they were meant to go together all along.
Which is why the software work interests me. Machines can test us as much as we test them.
If the raw data and the scoring rules are preserved before events occur, we can later ask whether the machine really found a forward signal or whether a human being merely told a good story about it afterward.
The Dry Coastal Event
There is another possibility worth keeping in the back of the mind. People naturally associate coastal disruption with storms, floods, waves and naval conflict because those are vivid physical events.
But suppose the great coastal disruption turns out to be dry. Suppose weakening economies reduce international trade. Cargo volumes collapse. Factories throttle back. Ship calls decline. Port employment falls. Warehouses empty. Coastal industrial districts lose their economic reason for being.
- The docks are still there.
- The water is still there.
- But the commerce is gone. Off the docks and into the mud on $50 diesel.
That could create a far more profound change in the world’s coastal infrastructure than a storm that shuts a port for a week.
Which raises a fascinating problem for predictive software: sometimes a system may identify the shape of a coming disruption while getting its physical cause wrong.
- Transportation interruption.
- Displacement.
- Shortages.
- Rerouting.
- Political blowback.
All of those might be correctly anticipated while “flood” turns out to have been the wrong domain interpretation.
That is something we ought to be able to score instead of hand-wave.
- Did the system identify the correct time?
- The correct sector?
- The correct consequences?
- The correct geography?
- And most importantly, the correct causal mechanism?
We should not let a correct consequence rescue an incorrect cause after the fact.
Otherwise we are right back to fortune-telling.
Next Moves
The next Climate Prediction Center long-range outlook package is due Thursday, and that will carry the conventional weather view farther toward year-end. We will put that into the ordinary-information pile where it belongs.
So will Taiwan. So will Hormuz. The new Houthiville.
So will the Black Sea, Yemen, shipping rates, diesel, crops, interest rates and everything else already visible to people who make a serious effort to watch the world. Oh, and yeah, the Fed Wednesday and globalist reactions thereafter.
Then OTH gets the harder assignment on its next run:
Tell us something we didn’t already know.
That is the standard.
Not whether we can find a future headline that resembles an earlier collection of words.
Not whether an analyst can produce an impressive narrative after events unfold. Not even whether a general direction was correct.
The question is whether there was measurable information gain over the competent observer’s baseline.
If mass public postings consistently provide that gain, then we will have learned something fascinating about human beings and information.
If they don’t, but machine analysis of ordinary news does, we will have learned something equally interesting about computational forecasting.
And if neither method reliably beats the competent analyst? Well, that is useful knowledge, too.
There’s an emergent science of the future trying to be born here. But we’re still crawling.
Before anybody gets to claim clairvoyance, prescience, predictive software or tomorrow’s secret decoder ring, there is one question that ought to be nailed over the laboratory door:
Where are the new bits?
Write when…yeah…when?
WinterStrength / flavorWhat followed that is useful to remember1982–83“El Niño of the century,” eastern PacificBrutal California/Gulf storminess; Peru floods; Indonesia/Australia drought; palm oil and tropical softs ripped higher into spring 1983; U.S. industrial gas up ~20% that year as weather and hydro shifted. Global income-loss estimates later put this event in the trillions.1997–98Peak ~+2.4 °C, classic EPCalifornia floods, warm north, wet South/Southeast. Indonesia drought + fires. Malaysian palm futures more than doubled Aug 97–Mar 98. U.S. gas jumped that winter on heat/hydro. Asian financial crisis was the other engine — climate was the crop/energy overlay.2015–16Very strong Niño-3.4, more CPWarm winter across much of the U.S.; California did not get a 97-style soaking. Still a big global tropical drought/flood split. Reminder that “historic SST” ? “historic California rain.”1972–73, 1957–58Strong, olderSame south-wet / north-warm skeleton; used in NOAA composites. Good for pattern, weaker for modern food-trade comparison.
NOAA’s own 11-event strong-Niño winter composite: Southeast wet in 8 of 11; Texas cooler than average in a majority of moderate+strong events; north warm/dry is the most repeatable temperature tell. Individual winters still scatter.
Food / energy / logistics — the logical chain, not a price target
From those three big winters, the repeatable sequence is:
Tropical ag first — SE Asia drought (palm, rice, rubber, coffee in some years), Andean/Peru flood vs drought split, Australian wheat/sugar stress. Price spikes in vegetable oils showed up into the following spring, not on the October heat day.
Southern U.S. field work — more rain, fewer good harvest/plant days, cotton and Gulf logistics get sloppy. That is a window problem, not a one-day food-price explosion.
Energy is two-sided — less hydro in drought tropics; more U.S. heating demand if the north is warm? Usually the opposite: warm north cuts heating, wet/cool south can lift power for wet soils and storms. 97–98 gas rose on southern heat + hydro, which is not identical to every Niño.
Inflation lag — 6–18 months is the honest “food problem” range after a historic Niño, especially if freight and fertilizer are already tight (your OTH Gulf/diesel thread). Circling a single date (Oct 29) is overfitting. Circling OND peak ? DJF pattern ? MAM crop/price realization is the analog.
East Texas expectation set (plain)
Fall: still hit-or-miss; don’t cash in a drought or a flood on September maps.
Winter: wetter-than-normal odds up, temperatures closer to seasonal or a bit cool versus the last decade’s warmth — not a guaranteed ice storm, not a drought winter.
Spring 2027: rain can hang on; field access and Gulf shipping weather matter more than the SST number.
Next summer: event likely decaying; do not plan 2027 summer as “another Niño.”
What would falsify this set
A sharp downward revision on the mid-September CPC maps; the warm pool sliding west and staying CP-flavored like 2015; or a strong sudden-stratospheric-warming / MJO pattern that parks a ridge over the South all winter. Those are the three ways a “historic Niño” winter still looks ordinary in Texas.
Begin-thinking-now range: plan winter water and field calendars off the 1982 / 1997 south-wet composite, keep a 2015 “warm and not that wet” branch in the drawer, and treat food/energy as a winter-into-next-harvest story — not a late-October one-day break.
i understand how your all mentally challenged now g . the picker has a new website . wait for it . he says . markets are rigged but trade them anyway . ahh good luck mate
Follow the money, len.
Martin Armstrong: This is starting to resemble the movie Terminator. There is a kill zone between both sides where you stick your head up, and you are killed by a drone. I know Driscoll has joined Eric Schmidt, the former CEO of Google and now head of the US defense company Perennial Autonomy, which operates in Ukraine. Schmidt has become the Merchant of Death (published 1934) for World War III like DuPont was for World War I. He claims he is defending democracy profiting from every kill, yet Russia has elections and Ukraine does not. Interesting how you look the other way when the money keeps rolling in.
Welcome to the world gone completely nuts as we head into 2032.
https://www.armstrongeconomics.com/uncategorized/does-anybody-know-what-they-are-doing-anymore/